How to quickly add graphs and charts to Rails app
… and check why 5600+ Rails engineers read also this
How to quickly add graphs and charts to Rails app
When how to visualize data in your Rails app there are certain factors that you need to consider.
- Static graphs which generate images are out of question. They are not any simpler to use, install or maintain and are less usable. The ability to toggle and highlight is just a necessity in XXI century. Thus our options are limited to charts generated with JavaScript.
- You are probably working for a startup with monetary constraints so using libraries which cost $200 is something might want to avoid.
- You would prefer something looking good out of the box, which can also be easily styled by designers to follow the look&feel of the whole app.
- You would like something maintained so it continues working in the future with newer browser versions without spending much time in upgrades.
I am gonna propose you use Google Charts. Interactive and maintained by Google.
Model + SQL
class Order < ApplicationRecord
  def self.totals_by_year_month
    find_by_sql(<<-SQL
      SELECT
        date_trunc('month', created_at) AS year_month,
        sum(amount) as amount
      FROM orders
      GROUP BY year_month
      ORDER BY year_month, amount
      SQL
    ).map do |row|
      [
        row['year_month'].strftime("%B %Y"),
        row.amount.to_f,
      ]
    end
  end
end
date_truncis a PostgreSQL function which truncates the date to certain precision.
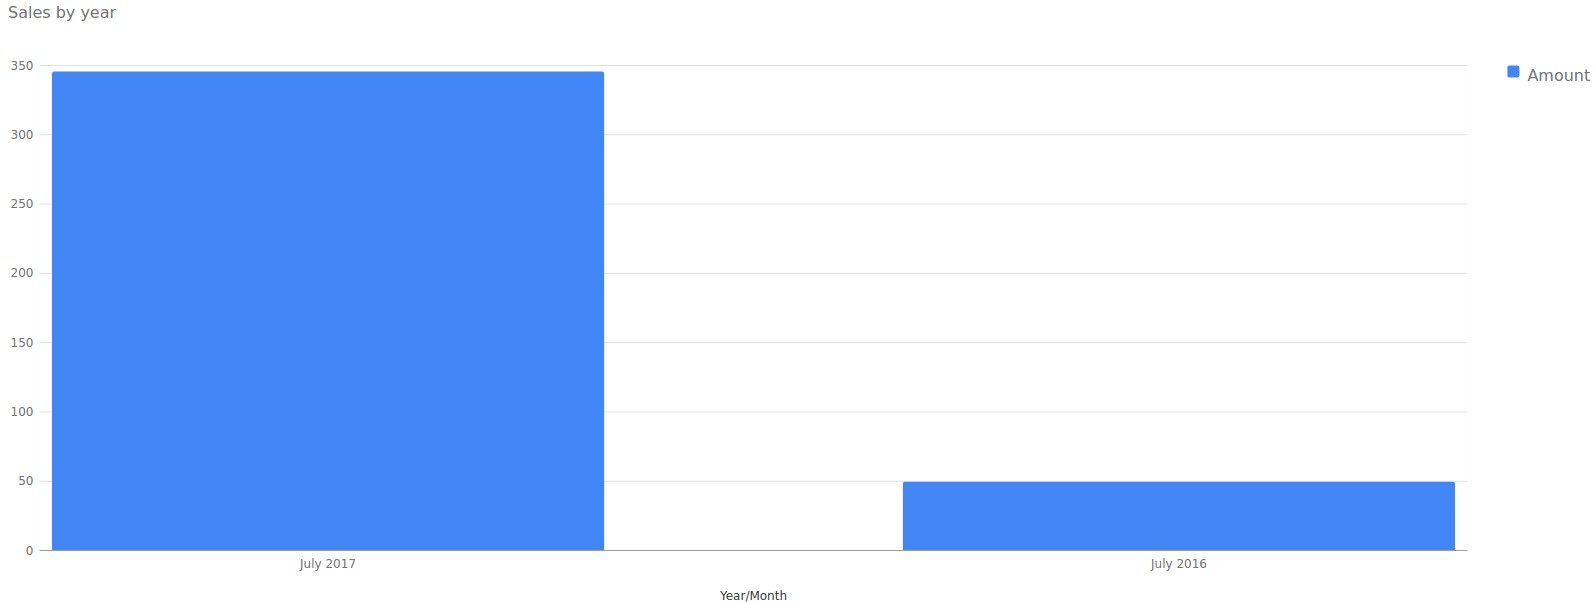
This methods returns the data in format such as:
[
  ["July 2017", 346.0],
  ["July 2016", 50.0],
]
Obviously it is up to you what data and how you want to visualize :) This is just a simple example.
Get your data in controller
class OrdersController < ApplicationController
  def index
    @data = Order.totals_by_year_month
  end
end
Pass to view and javascript
<div id="chart" style="width: auto; height: 600px;"></div>

<script type="text/javascript" src="https://www.gstatic.com/charts/loader.js"></script>
<%= javascript_tag do -%>
  google.charts.load('current', {'packages':['bar']});
  google.charts.setOnLoadCallback(drawChart);

  function drawChart() {
    var data = JSON.parse('<%= @data.to_json.html_safe -%>');
    data = [['Year/Month', 'Amount']].concat(data);
    data = google.visualization.arrayToDataTable(data);
    var options = {
      chart: {
        title: 'Sales by year',
      }
    };

    var chart = new google.charts.Bar(document.getElementById('chart'));
    chart.draw(data, google.charts.Bar.convertOptions(options));
  }
<% end -%>
And that’s it. If your needs are simple, if you don’t need chart which dynamically changes values, if you just want draw a diagram, that’s enough.
There are certain refactorings that you may want to apply once your needs get more sophisticated if you want to treat JavaScript and frontend code as first class citizen in your Rails app.
- Expose the data via JSON API and obtain it using AJAX
- Dynamically translate the column names and chart title
- Move the JavaScript to a separate file and trigger the integration based on certain HTML tags being present on the site
- Asynchronously load the required JavaScript from google:
https://www.gstatic.com/charts/loader.js
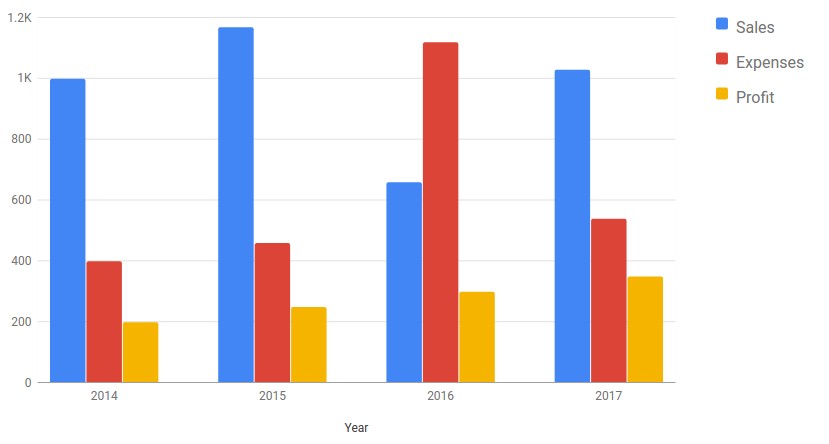
You can read more about creating bar charts using Google Charts and check out tons of available configuration options