Is your Rails application special?
… and check why 5600+ Rails engineers read also this
Is your Rails application special?
TL;DR
Legacy Rails applications can be unpredictable, so never assume anything about their behavior. The first step to stability is improving observability—understand how the system behaves before making changes. Identify bottlenecks using real data, optimize critical configurations, and ensure fast deployment rollback in case something goes wrong. Even small adjustments, like tuning concurrency settings, can have a significant impact on system reliability.
Cry for help
One day we received a request to help with an unstable Rails application in our inbox. They were experiencing frequent outages or slowdowns, and they were not able to identify the root cause. They had monitoring and alerting implemented using a third-party service. It made the problem evident.
The patient and the symptoms
The application was a B2B e-commerce platform. It was built of three main components:
- Public-facing website – a Rails application
- A legacy ERP system – a black box
- A middleware responsible for communication between the two – another Rails application
There was no observability, nor centralized logging implemented.
The application was deployed on AWS EC2 instances. The deployment process was automated using Ansible and a custom-built Rails application to run the deployment playbooks. However, the deployment application had no rollback feature. In case of a failure, they had to revert the changes, wait for CI tests, and then run the deployment again.
Both Rails applications were running on the same instances. There was no separation between them.
It was impossible to determine which application was consuming more server resources, except through real-time system monitoring tools like htop.
There were two application servers, each running the same set of applications. Additionally, there were two load balancers (Haproxy)—one facing the public website, the other facing the middleware.
The situation was so bad that they had to restart instances manually to recover from outages.
The preliminary steps
We started by adding NewRelic instrumentation to the Rails applications. We also wanted NewRelic infra agents installed on the servers. Since the infrastructure was managed with Ansible, we extended existing Ansible roles and playbooks to install the agents.
The investigation – first round
The first major finding was an infinite loop in the public-facing website. We identified it using NewRelic’s profiling feature. During one of the outages, we took a profiling session and analyzed it carefully.
The infinite loop was caused by a change in the ERP system’s API that was not reflected in the Rails application code. After we pointed it out, the client team was able to fix it quickly. Unfortunately, that was not the only issue. The faulty code was in a rarely used area of the application.
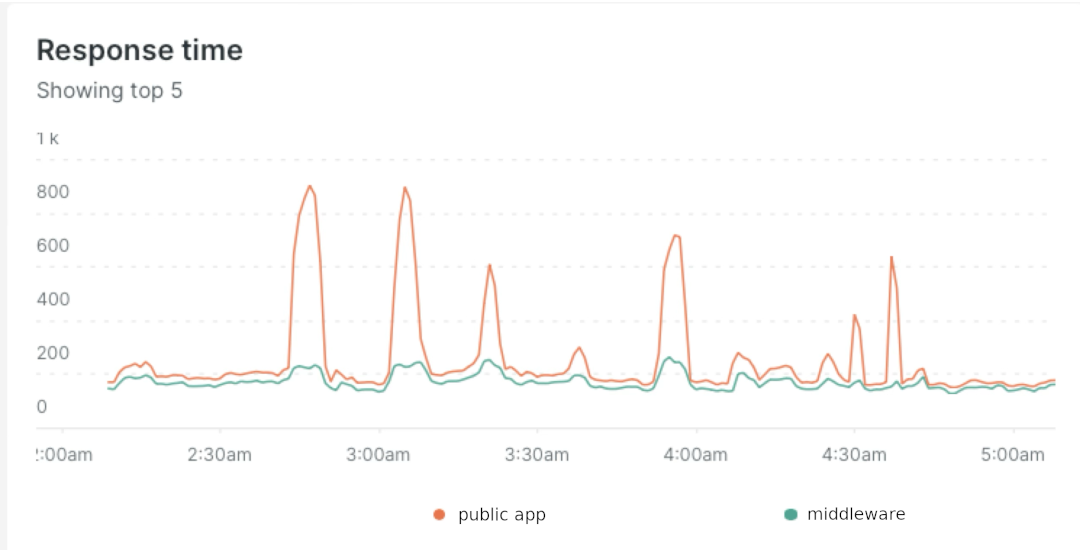
Next, we analyzed APM traces during outages, looking for patterns. We found that the public-facing application experienced significant increases in response time due to waiting for external web calls. However, the middleware’s response time increase was much smaller.
We asked the client team if they observed the same pattern in the ERP system. They didn’t. Something was off, but we didn’t know what yet. We started focusing on the middleware.
During one of the outages, we noticed (using htop on the application server) that all threads in the middleware process
were fully utilized. When we compared concurrency configurations between the middleware and the public-facing app,
we found a significant difference:
- Public app: 4 workers, 5 threads per worker, on each of two instances
- Middleware: 1 worker, 5 threads per worker, on each of two instances
As a quick fix, we increased the number of middleware workers to 2.
We also added the X-Request-Start HTTP header to Haproxy configurations to track request queuing in NewRelic.
The change significantly reduced the frequency of outages, but the problem wasn’t fully solved. Our hypothesis was that the middleware couldn’t handle the load from the public app. We needed to prove it.
We also started tracking middleware request queuing in NewRelic during outages.
The investigation was paused because the agreed budget had been exhausted.
The investigation – second round
After a few months, the client team contacted us again. We had already started a Ruby and Rails upgrade project for the public app, and they also asked us to investigate the stability issues further.
This time, we were better prepared. Through the upgrade project, we had gathered more knowledge about the application and its relationship with the middleware and ERP system. From the first round of investigation, we had a strong hypothesis that the middleware was the bottleneck. We added full middleware logging to NewRelic and started analyzing the logs.
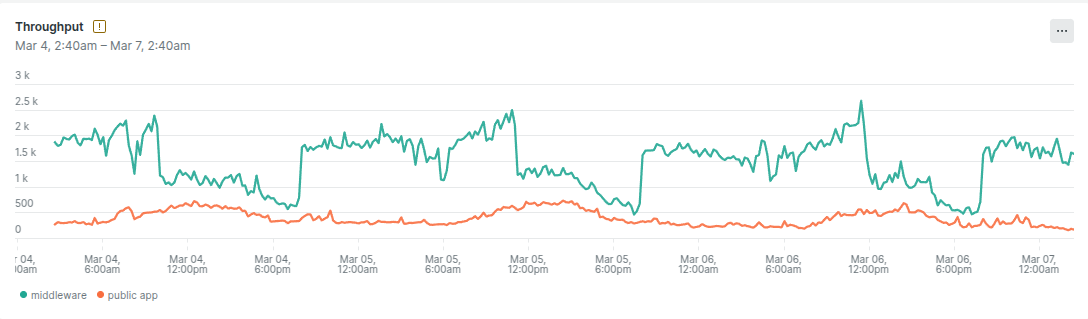
We discovered that the middleware’s throughput was an order of magnitude higher than that of the public app. It turned out that the middleware wasn’t only used by the public-facing application—it also handled traffic from internal applications, significantly increasing its load.
To confirm our theory, we attempted to trigger public app outages by artificially increasing the load on the middleware. It worked: higher middleware load resulted in public app outages. This strengthened our hypothesis that the middleware’s concurrency configuration was suboptimal.
Best practices for configuring Puma concurrency
Puma is the default Rails application server. It uses a multi-process, multi-threaded model.
For a long time, the default Puma configuration in Rails set the number of threads per worker to 5. Recently, DHH suggested lowering it. After an interesting discussion, the default has been changed to 3 threads per worker since Rails 7.2.
There is also a rule of thumb from Nate Berkopec, a Rails performance expert and Puma committer:
The optimal number is always 1 Puma worker process per 1 CPU core. Then, tune the thread count so that the CPU core is well-utilized at maximum load.
Following Nate’s advice, we decided not to increase the number of workers but instead adjust the number of threads. We were hesitant to use a high thread count due to the (in)famous GVL, which makes Ruby threads less efficient than native threads.
At this point, we started to think outside the box. Is our middleware Rails application similar to the typical Rails applications that the default settings were designed for? How different is it?
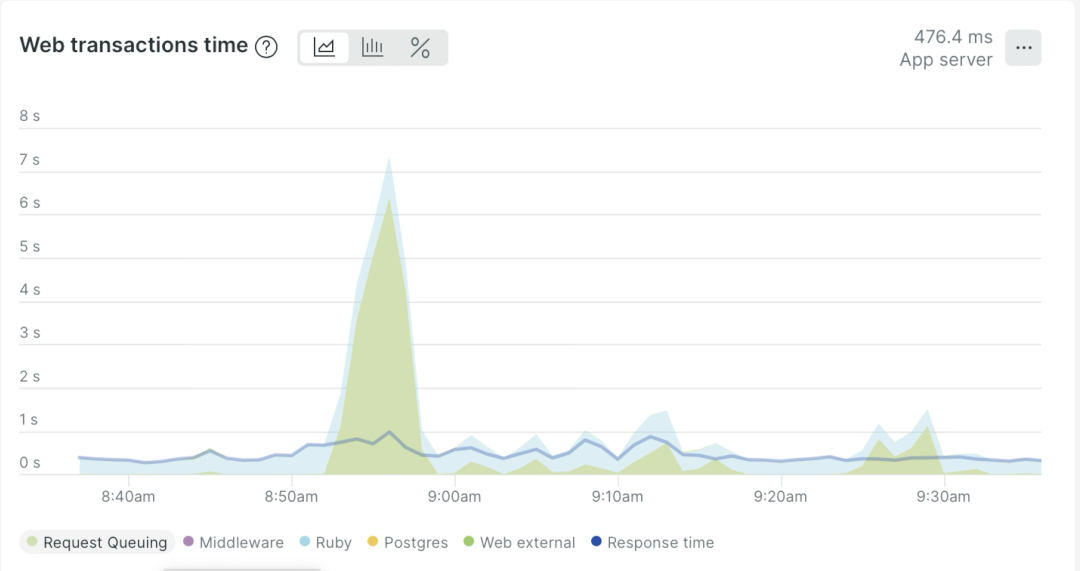
Let’s compare the web transaction breakdown of our middleware application:

With that of another Rails application we’ve worked with:
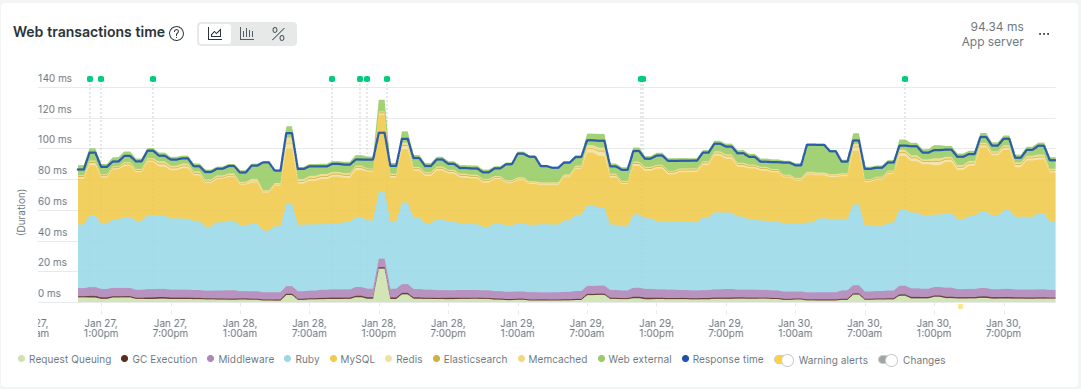
Do you see the difference? Our middleware app is mostly handling external requests, which means it is I/O-bound. I/O-bound workloads benefit from higher thread counts because threads spend most of their time waiting for I/O. Since Ruby releases the GVL when waiting for I/O, threads can be utilized more efficiently in this scenario.
The solution - tuning Puma concurrency settings
To ensure a safe, incremental rollout, we adjusted Ansible deployment roles to support different Puma configurations for each application server. We also had to tune haproxy configuration and introduce weighting based on the total threads count configured on each server. This allowed us to test different configurations gradually. We were deploying changes on one server at a time, monitoring the system closely.
Meanwhile, we also investigated how to implement a fast rollback mechanism. The original deployment rollback process took 30 minutes, requiring a full redeployment. We found a way to perform an Ansible-based rollback without using the custom deployment application. This reduced rollback time to just 3 minutes.
We’ve never had to rollback puma configuration changes, but it was good to have the option. It was very helpful in course of our upgrades project, but that’s a story for another time.
Through testing, we identified optimal Puma settings:
- Middleware: 3 workers, 20 threads
- Public app: 3 workers, 9 threads
Finally, we repeated our public app outage test.
With the original middleware configuration, high load caused the public app to crash.
With the new configuration, the system remained stable. We performed both tests using ab benchmarking tool with
the exact same parameters. See the results below:

Number of database connections
Before deploying the changes to both application servers, we also checked the number of database connections. It turned out that, with the new settings, we would be very close to the database connection limit.
But wait—doesn’t this application behave uniquely in that regard? Have you noticed how narrow the yellow area is in the middleware app breakdown chart?
After a quick investigation, we discovered that the middleware app was using the database only for authentication and authorization. We verified that it was safe to release the database connection back to the pool immediately after authentication and authorization.
  authorize! :perform, @task
  ActiveRecord::Base.connection_pool.release_connection

  # the following takes a lot of time
  render json: @task.perform
This allowed us to significantly reduce the number of database connections used by the middleware app. Each application process, configured with 20 threads, now used only 2 database connections.
Final thoughts
The stability of the system improved significantly after the changes. The client team was happy with the results. There is plenty of room for further improvements. It would be beneficial to break the public app dependency on the middleware on each request. Caching and eventual consistency patterns could be used to achieve this.