How I hunted the most odd ruby bug
… and check why 5600+ Rails engineers read also this
How I hunted the most odd ruby bug
Every now and then there comes a bug in programmer’s life that is different than anything else you’ve encountered so far. Last time for me it was 3 days of debugging to find out that MySQL was returning incorrect results. We didn’t have to do much to fix it. We removed an index and created it again from scratch. There, problem gone. But that was a few years ago.
Last week I was hunting an entirely different beast. But before we dive into details, let me tell you a bit about the business story behind it.
Business background
We are working on a ticketing platform which sells tickets for big events, festivals but also for smaller gigs. The nature of this industry is that from time to time there are spikes of sales when an organizer opens sales for hot tickets. Early birds discounts and other promotions. You’ve probably attended some conferences and concerts. You know how it works.
In our application there are tons of things that happen in the background. Especially after the sale. We want the sale to be extremely quick so that we can handle the spikes nicely without hiccups. So when the purchase is finalized we have 15 background jobs or maybe even more. Some are responsible for generating the PDFs of those tickets, some are responsible for delivering emails with receipts. Other communicate with 3rd party APIs responsible for delivering additional services for the buyers.
Let me show you how the sales spikes look like.

And their effect on the number of queued jobs that we had:

As you can notice we were not even processing our jobs fast enough to handle next spikes (other organizers, other events are still selling at the same time on our platform). During normal hours we were digging ourselves out from the 4K of jobs (sometimes we even had spikes to 40K jobs) but very slowly. So obviously we were not happy with our performance.
But I know our codebase and I know that many of background jobs do almost nothing. They do 1 or 2 SQL query and decide that given sale is not related to them. When the sales is related they need to do something which does take long times but often they quit very quickly. Also, we had 6 machines with 4 resque workers running on them so technically we had 24 processes for handling the load of jobs. And yet everything appeared to be… slow. Very slow.
I had this gut feeling that there is a hidden problem and we are missing something. We started investigating.
Confirming the problem
We logged in to our utility machines and simply checked with htop what are the processes doing, what’s the load etc.

The load was often between 0.2 - 0.4. For 2 CPU machines with 4 resque jobs running on each of them. In the moment
when they should be processing, like crazy, thousands of queued jobs. So that sounded ridiculously low.
We started watching resque logs which show when a job is taken and when it’s done. I was able to see jobs being processed normally one by one and then a moment later things stopped. A job was done but next job was not taken and started. But if you looked at the tree of processes on the server you could clearly see that a master resque process was still waiting for it’s child. Even though the child already reported the job as done.

31480 is a child processing a job, 30383 is the master process waiting for the child to finish. 31481 is a ruby
thread in the master ruby process just trolling you in htop output. Use Shift+h to disable viewing threads
in htop in the future. It took me long time to understand what’s going on because both parent and child processes had
2 additional threads for honeybadger and new relic.
So let’s reiterate the confirmed problem.
- Child process finished the job according to resque logs.
- Master process is still waiting for the child process to die
You must know that resque is forking child processes for every job and waiting for them to die before starting with next job in the queue.
Here is related part of code from resque
def work(interval = 5.0, &block)
  interval = Float(interval)
  $0 = "resque: Starting"
  startup

  loop do
    break if shutdown?

    if not paused? and job = reserve
      log "got: #{job.inspect}"
      job.worker = self
      working_on job

      procline "Processing #{job.queue} since #{Time.now.to_i} [#{job.payload_class_name}]"
      if @child = fork(job)
        srand # Reseeding
        procline "Forked #{@child} at #{Time.now.to_i}"
        begin
          Process.waitpid(@child)
        rescue SystemCallError
          nil
        end
        job.fail(DirtyExit.new($?.to_s)) if $?.signaled?
      else
        # ...
Investigating the issue
This was very hard. I started by adding more log statements on production to the resque gem to see what’s going on.
I found nothing really interesting. All I was able to see was that the child process did the job,
started firing at_exit hooks but was still hanging there.
I used strace to see what’s going on when then process was doing nothing and later and it was not very helpful.
futex(0x7fb955978744, FUTEX_WAIT_PRIVATE, 13, NULL) = 0
futex(0x7fb9559787c0, FUTEX_WAKE_PRIVATE, 1) = 0
rt_sigaction(SIGINT, {SIG_IGN, [], SA_RESTORER|SA_SIGINFO, 0x7fb954a7f0f0}, {0x7fb954f10630, [], SA_RESTORER|SA_SIGINFO, 0x7fb954a7f0f0}, 8) = 0
rt_sigaction(SIGINT, {SIG_DFL, [], SA_RESTORER|SA_SIGINFO, 0x7fb954a7f0f0}, {SIG_IGN, [], SA_RESTORER|SA_SIGINFO, 0x7fb954a7f0f0}, 8) = 0
close(47)                               = 0
close(39)                               = 0
close(43)                               = 0
close(45)                               = 0
close(44)                               = 0
close(48)                               = 0
close(52)                               = 0
close(53)                               = 0
close(46)                               = 0
close(50)                               = 0
close(49)                               = 0
close(51)                               = 0
close(11)                               = 0
close(16)                               = 0
close(54)                               = 0
close(18)                               = 0
open("/dev/null", O_RDWR|O_CLOEXEC)     = 11
dup2(11, 10)                            = 10
close(11)                               = 0
write(10, "\1\0\0\0\1", 5)              = 5
shutdown(10, SHUT_RDWR)                 = -1 ENOTSOCK (Socket operation on non-socket)
close(10)                               = 0
close(9)                                = 0
close(8)                                = 0
close(17)                               = 0
close(14)                               = 0
close(15)                               = 0
close(12)                               = 0
close(13)                               = 0
open("/dev/null", O_RDWR|O_CLOEXEC)     = 8
dup2(8, 55)                             = 55
close(8)                                = 0
write(55, "\1\0\0\0\1", 5)              = 5
shutdown(55, SHUT_RDWR)                 = -1 ENOTSOCK (Socket operation on non-socket)
close(55)                               = 0
close(7)                                = 0
write(4, "!", 1)                        = 1
munmap(0x7fb955573000, 1052672)         = 0
exit_group(0)                           = ?
I also used gdb to attach to the process and with thread apply all backtrace I was able to see:
Thread 3 (Thread 0x7fb955685700 (LWP 11705)):
#0  0x00007fb954b2baa3 in poll () from /lib64/libc.so.6
#1  0x00007fb954f8625a in thread_timer () from /usr/lib64/libruby21.so.2.1
#2  0x00007fb954837e46 in start_thread () from /lib64/libpthread.so.0
#3  0x00007fb954b3476d in clone () from /lib64/libc.so.6

Thread 2 (Thread 0x7fb947df2700 (LWP 11708)):
#0  0x00007fb95483c8ee in pthread_cond_timedwait () from /lib64/libpthread.so.0
#1  0x00007fb954f805ce in native_cond_timedwait () from /usr/lib64/libruby21.so.2.1
#2  0x00007fb954f81042 in native_sleep () from /usr/lib64/libruby21.so.2.1
#3  0x00007fb954f83972 in sleep_timeval () from /usr/lib64/libruby21.so.2.1
#4  0x00007fb954ed0765 in rb_f_sleep () from /usr/lib64/libruby21.so.2.1
#5  0x00007fb954f63fba in vm_call_cfunc_with_frame () from /usr/lib64/libruby21.so.2.1
#6  0x00007fb954f71b1e in vm_call_general () from /usr/lib64/libruby21.so.2.1
#7  0x00007fb954f67fc1 in vm_exec_core () from /usr/lib64/libruby21.so.2.1
#8  0x00007fb954f6c8c9 in vm_exec () from /usr/lib64/libruby21.so.2.1
#9  0x00007fb954f74ee7 in loop_i () from /usr/lib64/libruby21.so.2.1
#10 0x00007fb954e60827 in rb_rescue2 () from /usr/lib64/libruby21.so.2.1
#11 0x00007fb954f62a0e in rb_f_loop () from /usr/lib64/libruby21.so.2.1
#12 0x00007fb954f63fba in vm_call_cfunc_with_frame () from /usr/lib64/libruby21.so.2.1
#13 0x00007fb954f71b1e in vm_call_general () from /usr/lib64/libruby21.so.2.1
#14 0x00007fb954f686e4 in vm_exec_core () from /usr/lib64/libruby21.so.2.1
#15 0x00007fb954f6c8c9 in vm_exec () from /usr/lib64/libruby21.so.2.1
#16 0x00007fb954f6efd2 in invoke_block_from_c () from /usr/lib64/libruby21.so.2.1
#17 0x00007fb954f6f7f6 in vm_invoke_proc () from /usr/lib64/libruby21.so.2.1
#18 0x00007fb954f6f9aa in rb_vm_invoke_proc () from /usr/lib64/libruby21.so.2.1
#19 0x00007fb954f82d42 in thread_start_func_2 () from /usr/lib64/libruby21.so.2.1
#20 0x00007fb954f82f2e in thread_start_func_1 () from /usr/lib64/libruby21.so.2.1
#21 0x00007fb954837e46 in start_thread () from /lib64/libpthread.so.0
#22 0x00007fb954b3476d in clone () from /lib64/libc.so.6

Thread 1 (Thread 0x7fb955675700 (LWP 11703)):
#0  0x00007fb95483c56c in pthread_cond_wait () from /lib64/libpthread.so.0
#1  0x00007fb954f7f0e9 in native_cond_wait () from /usr/lib64/libruby21.so.2.1
#2  0x00007fb954f810d2 in native_sleep () from /usr/lib64/libruby21.so.2.1
#3  0x00007fb954f852f7 in rb_thread_terminate_all () from /usr/lib64/libruby21.so.2.1
#4  0x00007fb954e6203d in ruby_cleanup () from /usr/lib64/libruby21.so.2.1
#5  0x00007fb954e62275 in ruby_run_node () from /usr/lib64/libruby21.so.2.1
#6  0x00007fb955487a2b in main ()
Based on main in Thread 1 I assumed this was the main thread. And apparently there were 2 more threads.
rb_thread_terminate_all looked interesting to me but I could not google anything useful about it this internal
Ruby method.
I wasn’t sure what those two threads were for, which gems would use them. I was able to figure it out later with one trick:
# config/initializers/resque.rb
Resque.after_fork do
  at_exit do
    Thread.list.each{|t| Resque.logger.info t.backtrace.join("\n") }
  end
end
which gave me:
config/initializers/resque.rb:19:in `backtrace'
config/initializers/resque.rb:19:in `block (3 levels) in <top (required)>'
config/initializers/resque.rb:19:in `each'
config/initializers/resque.rb:19:in `block (2 levels) in <top (required)>'

new_relic/agent/event_loop.rb:118:in `select'
new_relic/agent/event_loop.rb:118:in `wait_to_run'
new_relic/agent/event_loop.rb:104:in `run_once'
new_relic/agent/event_loop.rb:99:in `run'
new_relic/agent/agent.rb:630:in `create_and_run_event_loop'
new_relic/agent/agent.rb:690:in `block (2 levels) in deferred_work!'
new_relic/agent.rb:453:in `disable_all_tracing'
new_relic/agent/agent.rb:687:in `block in deferred_work!'
new_relic/agent/agent.rb:667:in `catch_errors'
new_relic/agent/agent.rb:686:in `deferred_work!'
new_relic/agent/agent.rb:713:in `block in start_worker_thread'
new_relic/agent/threading/agent_thread.rb:14:in `call'
new_relic/agent/threading/agent_thread.rb:14:in `block in create'

honeybadger/agent.rb:302:in `sleep'
honeybadger/agent.rb:302:in `work'
honeybadger/agent.rb:283:in `block in run'
honeybadger/agent.rb:283:in `loop'
honeybadger/agent.rb:283:in `run'
honeybadger/agent.rb:175:in `block (2 levels) in start'
So I had two potential candidates to investigate. New Relic and Honeybadger.
I grepped their codebase for Thread, sleep, at_exit, Thread.join and investigated the code around it.
I was trying to find out if there could be a race condition, a situation in which the main ruby thread
from at_exit callback would call Thread.join to wait for a honeybadger or new relic thread responsible for either
collecting or sending data to them. But I could not find anything like it.
I configured New Relic and Honeybadger gems to work in DEBUG mode on one machine. I was watching the logs and
trying to figure out something odd at the moment when I saw resque doing nothing after the job was done. It was not
easy task because the occurences of those do-nothing` periods were quite random. Sometimes I was able to spot it
after 3 jobs were done. Other times it had to process 80 jobs for the problem to appear. Also it was not easy
to spot any kind of similarity. But at some point I noticed one pattern.
The previous log listing that I show you did not contain honeybadger when the problem occured. It looked like.
config/initializers/resque.rb:19:in `backtrace'
config/initializers/resque.rb:19:in `block (3 levels) in <top (required)>'
config/initializers/resque.rb:19:in `each'
config/initializers/resque.rb:19:in `block (2 levels) in <top (required)>'

new_relic/agent/event_loop.rb:118:in `select'
new_relic/agent/event_loop.rb:118:in `wait_to_run'
new_relic/agent/event_loop.rb:104:in `run_once'
new_relic/agent/event_loop.rb:99:in `run'
new_relic/agent/agent.rb:630:in `create_and_run_event_loop'
new_relic/agent/agent.rb:690:in `block (2 levels) in deferred_work!'
new_relic/agent.rb:453:in `disable_all_tracing'
new_relic/agent/agent.rb:687:in `block in deferred_work!'
new_relic/agent/agent.rb:667:in `catch_errors'
new_relic/agent/agent.rb:686:in `deferred_work!'
new_relic/agent/agent.rb:713:in `block in start_worker_thread'
new_relic/agent/threading/agent_thread.rb:14:in `call'
new_relic/agent/threading/agent_thread.rb:14:in `block in create'
So I decided to focus more of my efforts on looking into honeybadger logs and codebase. I still could not find out why would anything threading related in Honeybadger cause an issue. So I paid more attention to the logs. I even edited the gem on production to produce much more logs. And then I noticed something:
This is how the logs looked like when everything went fine (line numbers might not reflect those in your codebase as I added more debugging statements). One line highlighted for your convinience.
15:27:27.137465 #11085] starting agent level=0 pid=11085 at="lib/honeybadger/agent.rb:172:in `block in start'"
15:27:27.138673 #11085] agent discarding trace duration=279.26 feature=traces id=c2ee2e5d-bfbf-4c9b-84dd-5a959dc125ac level=0 pid=11085 at="lib/honeybadger/agent.rb:236:in `trace'"
15:27:27.140279 #11085] stopping agent level=0 pid=11085 at="lib/honeybadger/agent.rb:182:in `stop'"
15:27:27.140410 #11085] cleared pid level=0 pid=11085 at="lib/honeybadger/agent.rb:187:in `stop'"
15:27:27.140550 #11085] killed thread level=0 pid=11085 at="lib/honeybadger/agent.rb:191:in `stop'"

15:27:27.140727 #11085] stopping agent level=0 pid=11085 at="lib/honeybadger/agent.rb:296:in `ensure in run'"

15:27:27.140874 #11085] flushed traces level=0 pid=11085 at="lib/honeybadger/agent.rb:195:in `stop'"
15:27:27.141150 #11085] flushed metrics level=0 pid=11085 at="lib/honeybadger/agent.rb:197:in `stop'"
15:27:27.141271 #11085] shuutting down worker notices level=0 pid=11085 at="lib/honeybadger/agent.rb:201:in `block in stop'"
15:27:27.141436 #11085] shut down worker notices level=0 pid=11085 at="lib/honeybadger/agent.rb:203:in `block in stop'"
15:27:27.141553 #11085] shuutting down worker traces level=0 pid=11085 at="lib/honeybadger/agent.rb:201:in `block in stop'"
15:27:27.141683 #11085] shut down worker traces level=0 pid=11085 at="lib/honeybadger/agent.rb:203:in `block in stop'"
15:27:27.141810 #11085] shuutting down worker metrics level=0 pid=11085 at="lib/honeybadger/agent.rb:201:in `block in stop'"
15:27:27.141946 #11085] shut down worker metrics level=0 pid=11085 at="lib/honeybadger/agent.rb:203:in `block in stop'"
And compare it to:
15:27:27.806954 #11091] starting agent level=0 pid=11091 at="lib/honeybadger/agent.rb:172:in `block in start'"
15:27:27.807586 #11091] agent discarding trace duration=222.84 feature=traces id=a55c3984-4835-468a-a89e-d7ddf4a0b499 level=0 pid=11091 at="lib/honeybadger/agent.rb:236:in `trace'"
15:27:27.810092 #11091] stopping agent level=0 pid=11091 at="lib/honeybadger/agent.rb:182:in `stop'"
15:27:27.810326 #11091] cleared pid level=0 pid=11091 at="lib/honeybadger/agent.rb:187:in `stop'"
15:27:27.810553 #11091] killed thread level=0 pid=11091 at="lib/honeybadger/agent.rb:191:in `stop'"
15:27:27.810813 #11091] flushed traces level=0 pid=11091 at="lib/honeybadger/agent.rb:195:in `stop'"
15:27:27.811129 #11091] flushed metrics level=0 pid=11091 at="lib/honeybadger/agent.rb:197:in `stop'"
15:27:27.811368 #11091] shuutting down worker notices level=0 pid=11091 at="lib/honeybadger/agent.rb:201:in `block in stop'"
15:27:27.811576 #11091] shut down worker notices level=0 pid=11091 at="lib/honeybadger/agent.rb:203:in `block in stop'"
15:27:27.811761 #11091] shuutting down worker traces level=0 pid=11091 at="lib/honeybadger/agent.rb:201:in `block in stop'"
15:27:27.812008 #11091] shut down worker traces level=0 pid=11091 at="lib/honeybadger/agent.rb:203:in `block in stop'"
15:27:27.812246 #11091] shuutting down worker metrics level=0 pid=11091 at="lib/honeybadger/agent.rb:201:in `block in stop'"
15:27:27.812525 #11091] shut down worker metrics level=0 pid=11091 at="lib/honeybadger/agent.rb:203:in `block in stop'"

15:27:37.813214 #11091] stopping agent level=0 pid=11091 at="lib/honeybadger/agent.rb:296:in `ensure in run'"
The second time stopping agent appears in the log exactly after 10 seconds.
Digging into Honeybadger’s code
And guess what I’ve remembered from reading Honeybadger codebase.
def initialize(config)
  @config = config
  @delay = config.debug? ? 10 : 60
And here is where that delay is being used inside work method:
def run
  loop { work } # <<-- HERE
rescue Exception => e
  error {
    msg = "error in agent thread (shutting down) class=%s message=%s\n\t%s"
    sprintf(msg, e.class, e.message.dump, Array(e.backtrace).join("\n\t"))
  }
ensure
  d { sprintf('stopping agent') }
end

def work
  flush_metrics if metrics.flush?
  flush_traces if traces.flush?
rescue StandardError => e
  error {
    msg = "error in agent thread class=%s message=%s\n\t%s"
    sprintf(msg, e.class, e.message.dump, Array(e.backtrace).join("\n\t"))
  }
ensure
  sleep(delay) # <<-- HERE
end
And the work methods is being called from inside of run method which is what Honeybadger is scheduling in a
separate thread.
def start
  mutex.synchronize do
    return false unless pid
    return true if thread && thread.alive?

    debug { 'starting agent' }

    @pid = Process.pid
    @thread = Thread.new { run } # <<-- HERE
  end

  true
end
Ok, so we have a thread running which sometimes sleeps. But how would that affect us? Why would it matter.
After all when Ruby main thread finishes it does not care about other threads that are running. Also
Honeybadger is not doing Thread.join at any point to wait for that thread. If anything, it’s doing the opposite.
Check it
out.
It’s killing the Thread.
at_exit do
  stop if config[:'send_data_at_exit']
end
def stop(force = false)
  debug { 'stopping agent' }

  mutex.synchronize do
    @pid = nil
  end

  # Kill the collector
  Thread.kill(thread) if thread # <<-- HERE

  unless force
    flush_traces
    flush_metrics
  end

  workers.each_pair do |key, worker|
    worker.send(force ? :shutdown! : :shutdown)
  end

  true
end
Epiphany
At some point I realized a fact that was somehow missing my attention.
There are two cases what can happen inside work method.
Imagine that there is an exception when we sleep
def work
  flush_metrics if metrics.flush?
  flush_traces if traces.flush?
rescue StandardError => e
  error {
    msg = "error in agent thread class=%s message=%s\n\t%s"
    sprintf(msg, e.class, e.message.dump, Array(e.backtrace).join("\n\t"))
  }
ensure
  sleep(delay) # <- Exception here
end
What would happen is that the we would quit the ensure block and the exception would
bubble up. That’s an easy and harmless scenario.
But what happens when the exception happens inside one of the flush methods?
def work
  flush_metrics if metrics.flush? # <- Exception here
  flush_traces if traces.flush?
rescue StandardError => e
  error {
    msg = "error in agent thread class=%s message=%s\n\t%s"
    sprintf(msg, e.class, e.message.dump, Array(e.backtrace).join("\n\t"))
  }
ensure
  sleep(delay)
end
We land inside the ensure block and we sleep. It was an interesting revelation for me.
It seemed important and similar to what might randomly happen in real life. A race condition in
action.
And thread being killed is like an exception in your ruby code.
But I still could not find any Ruby code that would actually wait for that Thread. But everything pointed out that something does indeed wait for it.
In which we bring Ruby as a witness
So I decided to create a very small piece of Ruby code similar to what Honeybadger does. Just to convince myself that Ruby is not guilty here. And that I am clearly missing something which causes this whole situation to occur.
Here is what I wrote.
require 'securerandom'
class MyThread < ::Thread; end

def delay
  15
end

def run
  loop { work }
rescue Exception => e
  puts "#{Time.now} Exception"
ensure
  puts "#{Time.now} stopping agent"
end


def work
  puts "#{Time.now} start work"
  10_000_000.times { SecureRandom.hex }
  puts "finished work"
rescue StandardError => e
  puts "#{Time.now} Error"
ensure
  puts "#{Time.now} start sleep"
  sleep(delay)
  puts "#{Time.now} finished sleep"
end

t = MyThread.new{ run }

at_exit do
  puts "#{Time.now} killing thread"
  Thread.kill(t)
  puts "#{Time.now} killed thread"
end

sleep(10)
exit
This 10_000_000.times { SecureRandom.hex } is just there so that it takes more than 10 seconds which we wait
in main thread before trying to exit the whole program.
And here is the output:
2016-04-15 11:07:09 +0200 start work
2016-04-15 11:07:19 +0200 killing thread
2016-04-15 11:07:19 +0200 killed thread
2016-04-15 11:07:19 +0200 stopping agent
Well, nothing interesting here. I was obviously right. Ruby does not wait for other threads to finish. So the program stopped after 10 seconds. What else would you expect? But you never know, so let’s execute it again.
2016-04-15 11:07:26 +0200 start work
2016-04-15 11:07:36 +0200 killing thread
2016-04-15 11:07:36 +0200 killed thread
2016-04-15 11:07:36 +0200 start sleep
2016-04-15 11:07:51 +0200 finished sleep
2016-04-15 11:07:51 +0200 stopping agent
And here we are with our problem reproduced. This time Ruby waited for the thread t to finish. So it waited
for the 15s sleep delay inside the ensure block. I did not see that coming.
I was able to randomly cause this behavior in Ruby 2.1, 2.2 and 2.3 as well. The behavior of this program
was non-deterministic for me. Sometimes it waits and sometimes it does not.
Hotfixing
Now that I was sure that I have not missed any code in Honeybadger and for, so far unknown, reason Ruby just waits for its thread to finish; it was time to hot-fix the problem.
I knew I could just use send_data_at_exit config to omit the problem. But I want to have my exceptions from
background jobs logged. And since if there is an exception the jobs immediately finishes and quits I was afraid
we would miss them. So I wanted to dig into the root problem of it and find a fix or workaround that would let us
still send the last data when the program quits.
Here is my very simple hotfix. It skips the sleep phase if the thread is aborting which is the state it has
after being killed with Thread.kill.
if Honeybadger::VERSION != "2.1.0"
  raise "You've upgraded the gem. Check if the hotfix still applies
  an in identical way! They might have changed #work method body."
end
Honeybadger::Agent.class_eval do
  def work
    flush_metrics if metrics.flush?
    flush_traces if traces.flush?
  rescue StandardError => e
    error {
      msg = "error in agent thread class=%s message=%s\n\t%s"
      sprintf(msg, e.class, e.message.dump, Array(e.backtrace).join("\n\t"))
    }
  ensure
    sleep(delay) unless Thread.current.status == "aborting" # 'unless' is the hotfix
  end
end
I notified Honeybadger, Resque and Ruby team about this problem and I hope they will come up with a good coldfix.
Results
The spectacular effect was visible immediately in all metrics that we had.
The remaining jobs were processed much much faster after the hotfix deployment.

The CPU usage became much higher on the utility machines for the time they were processing the spike.
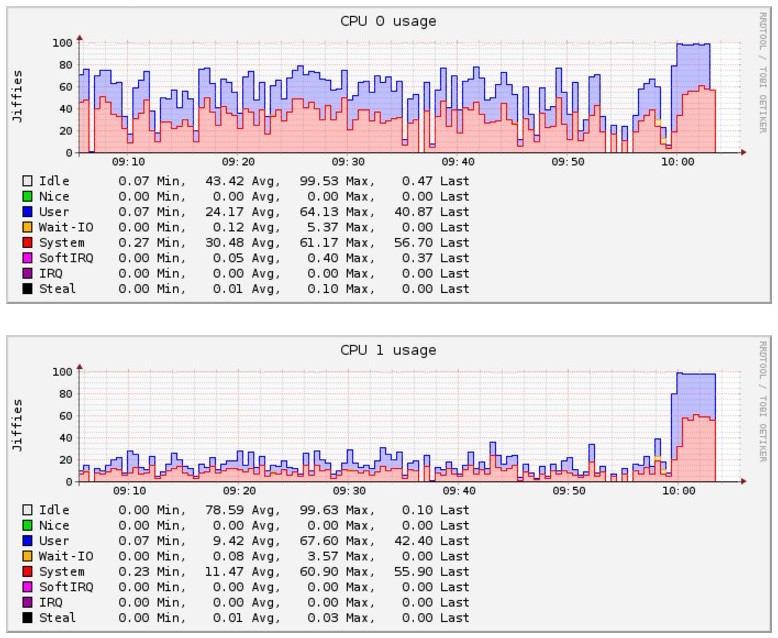
I suspect that with that improvement we will be even able to decommission some of them.
Learn more
Did you like this article? You will find our Rails books interesting as well . We especially recommend Responsible Rails which contains more stories like that.